Bullet physics optimization for iOS | |
| March 31st, 2011 | |
 |
In evaluating the core fun mechanic of Cannonade, one thing I realized was that a large part of the fun comes from just watching the blocks fall down and fly apart. However, it isn’t enough to have the simulation run and produce natural looking results if the framerate is not high enough to give your brain a good sense of the motion. After seeding Cannonade 0.5.6 and playing a few games with the significantly more complex test castles, it was evident to me that some of the fun was being lost in the low framerate. So I decided to take some time to work on performance now as opposed to further down the road where it usually happens. From the very beginning I knew that the physics performance was going to be a major issue, maybe even the primary bottleneck in Cannonade. I decided to take 2 days to concentrate on nothing but the performance of the bullet physics engine itself. There are many things I could do to lower the amount of work that bullet has to do but ultimately there is always going to be a substantial amount of work that it needs to crunch and so it should be well worth the time to get it to run faster. This is an account of my adventures in this area and my knowledge of the subject at this point.
Performance Measurement
The first thing needed whenever you do performance optimization is good way to measure the performance. To do so I decided to have Cannonade run through an audit of game that has already been played and see how much time it takes to simulate only the gameplay. This is not completely ideal however and I soon found that measuring the performance of physics simulation in the context of my game is actually rather difficult. Cannonade’s physics simulation must always be deterministic across replays, network clients and serialization. This presents some problems because even subtle changes in code generation will cause the simulation to run completely differently. Even though the calculation differences can be slight, they compound over time and create observable differences in the simulation very quickly. Thus any attempt at replaying an existing game with anything other than the exact binary the original simulation ran through will not give correct results. More importantly to our task at hand though is that it could artificially increase or decrease the amount of work that the simulation runs through, thus affecting the results of the test.

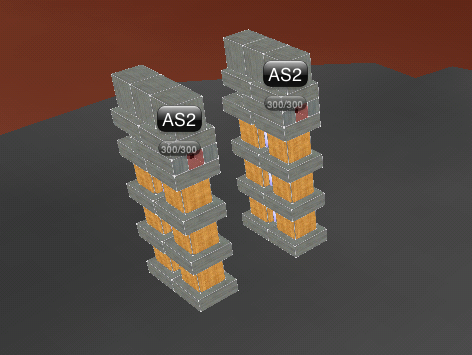
So I am stuck with two opposing forces conspiring to introduce inaccuracy into my performance measurement. One is that the longer I run the test simulation, the more the results will diverge between differently configured runs. On the other side of the spectrum is that the shorter I make the simulation, the more jitter/noise will be introduced by background processes, timing inaccuracies and the like. I eventually decided to go for a relatively short and simple testing scenario. I set up the standard level with two relatively complex castles. I have the turret in the right tower of one of the castles shoot a tank shell into the back wall of the interior. What this does is that it activates the simulation of every block in the tower but isn’t a big enough of an action to cause it to fall over or not settle down quickly (“settling down” is the term I use to describe when the physics simulation has determined that objects are no longer moving). This action amounts to around 150 frames of simulation before the system settles down. I decided that for the time being this was the best metric that I could come up with and decided to start testing.
The Simulation Code

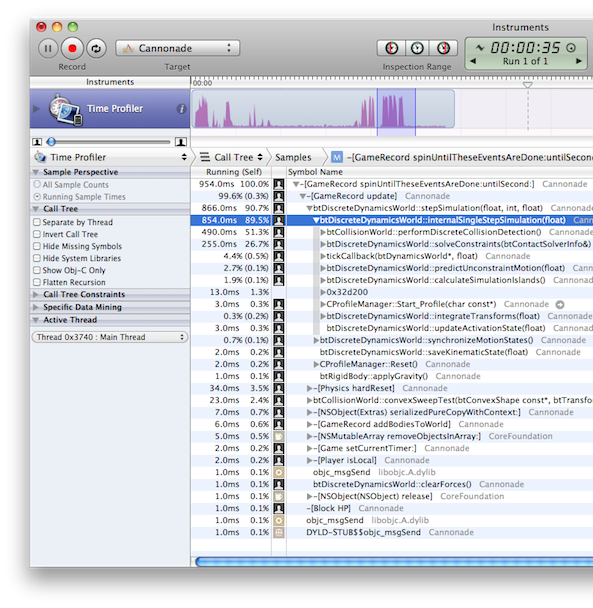
The bullet simulation code itself is written in C++ and makes very heavy use of floating point operations. The simulation work to be measured is single-threaded, doesn’t appear to block and is easily isolatable. From an Instruments.app sample it appears that about 90% of the work under measurement is taken up purely by bullet while the rest is overhead or other gameplay logic. It also appears that simulation performance is very proportionate to CPU clock speed as I observed that the ratio between the times it took to run on an iPad and an iPhone 3GS (which have the same CPU) was almost exactly equal to the inverse proportion of their clock speeds (1000 MHz vs 600 MHz respectively). I also want to try out the iPhone 4 (800 MHz) to confirm that the principle holds.
Testing Methodology
For testing I used a 1st generation Wi-Fi iPad with nothing actively running in the background (other than the occasional mail process or other standard system processes). Each run was performed after a fresh launch of the app and there were at least three runs per configuration. Occasionally there were obvious outlying results (most likely due to background processes such as getting new email or other things) which were thrown out. To ensure that the exact same simulation code is always executed even though things like bug fixes and added features can go into the app I segregated bullet into its own static library which (barring some very compelling reason) will remain the same forever after the first public 1.0 launch once I have settled on the fastest version I can get. libbullet.a is built or modified differently for each set of runs, linked into a debug version of Cannonade and the test is run. Time is measured simply computing the difference of CFAbsoluteTimeGetCurrent() at the start and end of a routine called [GameRecord spinUntilTheseEventsAreDone:untilSecond:]. The results are the average of three separate runs per configuration. The version of the bullet source used is the subversion trunk r2356.
The Tests and Results
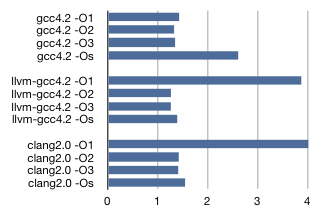
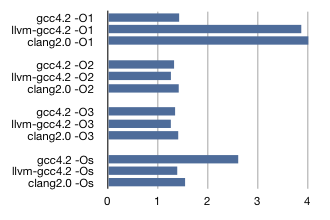
The most low hanging fruit I went after was to start tweaking compilers and compiler options. I tried three different compilers (gcc4.2, llvm-gcc4.2, clang2.0), four different optimization levels (-O1, -O2, -O3, -Os) and a whole slew of compiler options and source modifications. Here are the results (in seconds taken to run the simulation) of the bullet source unmodified and default compiler options as configured in Xcode (except for optimization levels and -mthumb is OFF):
 |
 |
So it is a pretty close race in many cases. Strictly by the numbers it appears like llvm-gcc4.2 -O3 is the winner with an average run time of 1.26 seconds which is down substantially from the configuration that I had been using which was gcc4.2 -Os at 2.60 seconds. Again, it is hard to say with high confidence which configuration truly is the winner because of simulation divergence and the amount of noise introduced from such a short sampling period but it is all I have to go on for the time being. So I decided to work with llvm-gcc4.2 -O3 and see how much I could squeeze even further with that as a base configuration.
The next thing I did was to play around with various compiler options. A few of them had some significant impact (both for better and worse) and some seemed to not have any effect at all. I tried them in various combinations with each other and sometimes bumped down between lower optimization levels and tried out specific optimization options individually. Eventually I settled on these four:
| -fno-exceptions | Disables C++ exception handling |
| -fno-rtti | Disables C++ runtime type information |
| -mdynamic-no-pic | Disables generation of position independent code |
| -ffast-math | Disables IEEE754 floating point compliance |
First I added -fno-exceptions and -fno-rtti. These extra language features add overhead even if they aren’t being used and turning them on lowered the runtime to 1.14 seconds. I then turned on -mdynamic-no-pic and got the time down to 1.12 seconds. Because the bullet code is statically linked we can turn this option on and leverage consistently known code locations. I then turned on -ffast-math which brought the time down even further to 1.08 seconds. There is a raging debate as to whether turning on -ffast-math is generally a good idea or not. I suspect that in my case as long as the determinism holds it will be fine but I will be watching closely to make sure that it does. I was feeling pretty good at this point! I had reached a good amount of performance savings thus far without any code changes at all! It was time to see if I couldn’t get the number down even further with some well placed code changes in bullet. There were two main avenues of code modification that I tried out:
BLAS
I investigated the Accelarate.framework (which was new in iOS 4.0) to see if there was anything that could help me there. From the partial functionality implemented on the iOS version of the Accelarate.framework it looked like I might be able to leverage vector and matrix routines from BLAS to gain some speed. These routines are optimized for the hardware you are running on and are future proof because they will be re-optimized by Apple as future hardware ships. I replaced a large number of routines in btVector3.h with BLAS equivalents. Unfortunately this didn’t help and instead increased runtime by about 25% from the watermark at the time. I have guessed that it might have been due to the fact these very small functions (with a lot of arguments) were dynamically linked and thus not inlined like the native code present in btVector3.h. Perhaps if I had replaced some of the more substantial matrix methods with BLAS routines it would have offset the function call overhead and made the tradeoff worth it but I instead started to investigate another avenue.
NEON SIMD
The next thing I tried out was replacing the constraint solver with a NEON SIMD version that had been shared in the bullet forums about a year ago. NEON is a single instruction, multiple data (SIMD) architecture extension of armv7. This had good promise for some speed boost and there was already a working SSE version that it was based on in the bullet source trunk. After integrating what had been shared and updating it for changes made to the source tree since the NEON version was attempted I was able to get it to run correctly and perform good simulations. Unfortunately, it also did not yield the performance improvement that I had hoped for. Like my BLAS changes, the NEON constraint solver was about 25% slower than the current watermark. After looking at the assembly generated for the unmodified constraint solver it appears that llvm-gcc4.2 is already generating vector instructions where appropriate and so my current guess is that the compiler is just generating more efficient instructions than the hand written code.
Conclusion
In conclusion, performance optimization is a fun kind of voodoo that I enjoy and am continually learning about. For now I am content with my compiler-based gains and can’t justify any more time on speeding up the physics simulation at the moment. Next up is graphics engine optimization. See any flaws in my methods/analysis above? Any advice on other optimizations I could try? Let me know in the comments.


February 2nd, 2012 at 1:32 am
Its good to see that you have put this much effort in optimizing the Physics engine. The best part is you shared it here. 🙂 Thanks very much
November 28th, 2013 at 4:24 am
I am quite new with this… Will this same physics work for iOS7 too??